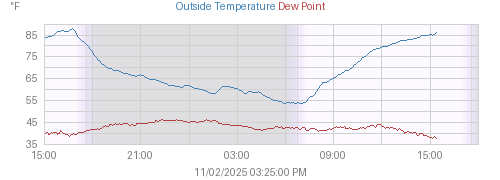
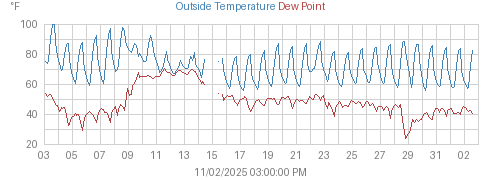
Temperature
| Current | 86.0°F |
| High | 86.1°F at 03:24:03 PM |
| Low | 53.5°F at 06:55:09 AM |
| Diurnal Variation | 32.6°F |
Conditions
| Heat Index | 82.8°F |
| Dewpoint | 37.6°F |
| Dewpoint Depression | 48.4°F |
| Humidity | 18% |
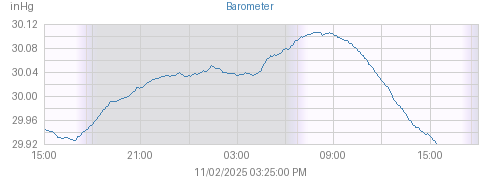
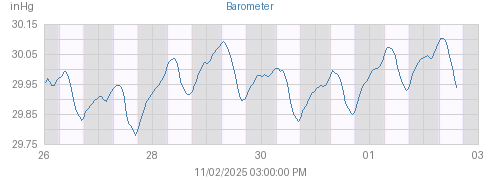
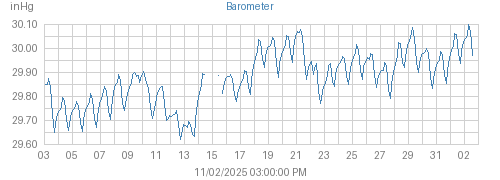
| Pressure | 29.921 inHg |
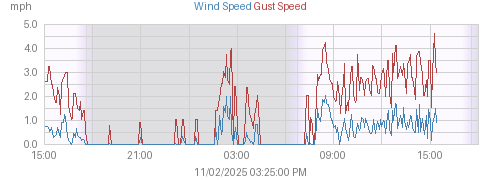
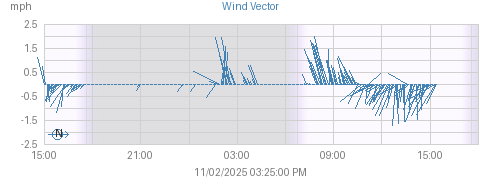
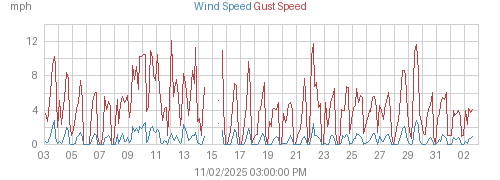
Wind
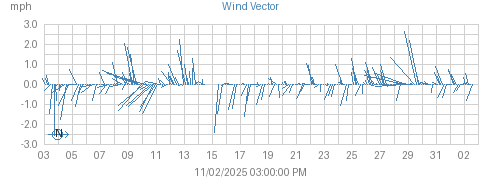
| Current | 1 mph from ESE |
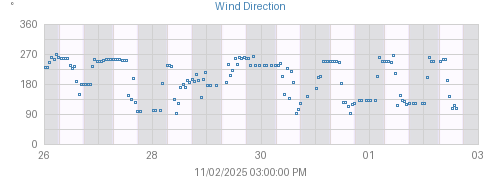
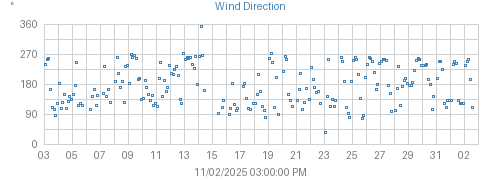
| Average | 0 mph from 181° |
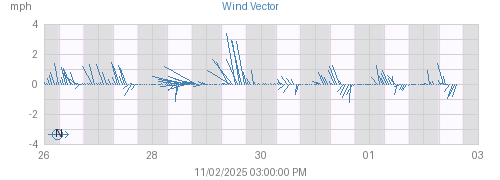
| High | 5 mph from 135° at 03:11:17 PM |
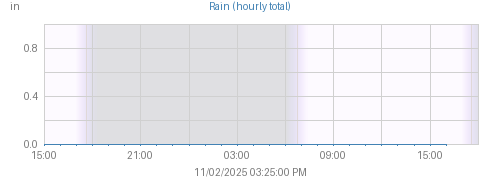
Precipitation
| Last Rain | 10/13/2025 06:50:00 PM |
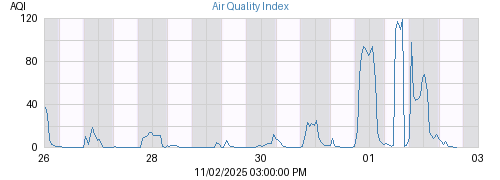
Air Quality
| PM 1 | 0.0 µg/m³ |
| PM 2.5 | 0.0 µg/m³ |
| PM 10 | 0.1 µg/m³ |
Temperature
| High | 87.9°F at 04:42:27 PM |
| Low | 54.9°F at 06:58:32 AM |
| Diurnal Variation | 33.0°F |
Conditions
| Max Heat Index | 84.8°F at 04:44:04 PM |
| Max Dewpoint | 46.4°F at 11:10:48 PM |
| Min Dewpoint | 38.1°F at 04:32:59 PM |
| Max Humidity | 62% at 02:52:59 AM |
| Min Humidity | 18% at 04:32:59 PM |
Wind
| Average | 0 mph |
| Vector | 0 mph from 224° |
| High | 4 mph from 270° at 04:58:32 AM |
Precipitation
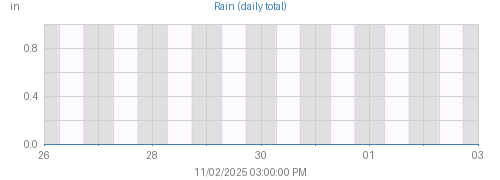
| Accum | 0.00 in |
| Max Rate | 0.00 in/hr at 12:00:07 AM |
Air Quality (Highs)
| PM 1 | 461.0 µg/m³ |
| PM 2.5 | 1443.0 µg/m³ |
| PM 10 | 1721.0 µg/m³ |
Temperature
| High | 86.1°F at 03:24:03 PM (Sunday) |
| Low | 53.5°F at 06:55:09 AM (Sunday) |
| Max Heat Index | 82.9°F at 03:20:48 PM (Sunday) |
Conditions
| Max Dewpoint | 46.1°F at 12:59:35 AM (Sunday) |
| Min Dewpoint | 37.0°F at 03:06:53 PM (Sunday) |
| Max Humidity | 66% at 06:58:31 AM (Sunday) |
| Min Humidity | 18% at 03:20:08 PM (Sunday) |
Wind
| Average | 1 mph |
| Vector | 0 mph from 181° |
| High | 5 mph from 135° at 03:11:17 PM (Sunday) |
Precipitation
| Accum | 0.00 in |
| Max Rate | 0.00 in/hr at 12:00:05 AM (Sunday) |
Air Quality (Highs)
| PM 1 | 20.0 µg/m³ |
| PM 2.5 | 27.0 µg/m³ |
| PM 10 | 34.0 µg/m³ |
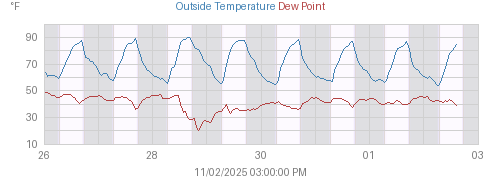
Temperature
| High | 90.8°F at 3:40PM on Tuesday |
| Low | 53.5°F at 6:55AM on Sunday |
| Max Heat Index | 87.0°F at 4:00PM on Tuesday |
Conditions
| Max Dewpoint | 49.4°F at 12:54AM on Sunday |
| Min Dewpoint | 18.9°F at 8:51PM on Tuesday |
| Max Humidity | 68% at 6:25AM on Tuesday |
| Min Humidity | 10% at 7:52PM on Tuesday |
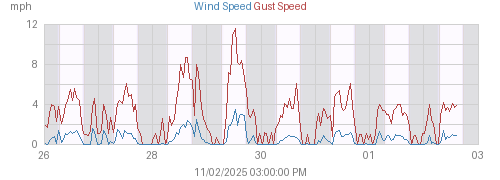
Wind
| Average | 1 mph |
| Vector | 0 mph from 224° |
| High | 12 mph from 246° at 12:36PM on Wednesday |
Precipitation
| Accum | 0.00 in |
| Max Rate | 0.00 in/hr at 12:00AM on Sunday |
Temperature
| High | 87.9°F on Nov 1 at 4:42PM |
| Low | 53.5°F on Nov 2 at 6:55AM |
| Max Heat Index | 84.8°F on Nov 1 at 4:44PM |
Conditions
| Max Dewpoint | 46.4°F on Nov 1 at 11:10PM |
| Min Dewpoint | 37.0°F on Nov 2 at 3:06PM |
| Max Humidity | 66% on Nov 2 at 6:58AM |
| Min Humidity | 18% on Nov 1 at 4:32PM |
Wind
| Average | 0 mph |
| Vector | 0 mph from 208° |
| High | 5 mph from 135° on Nov 2 at 3:11PM |
Precipitation
| Accum | 0.00 in |
| Max Rate | 0.00 in/hr on Nov 1 at 12:00AM |
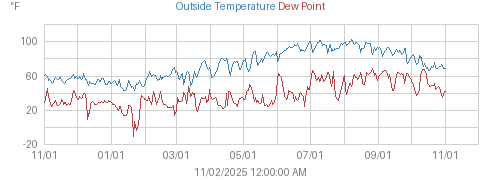
Temperature
| High | 117.5°F at 08/07/2025 04:02:58 PM |
| Low | 27.4°F at 01/14/2025 07:30:48 AM |
| Max Heat Index | 119.9°F at 08/21/2025 02:48:30 PM |
Conditions
| Max Dewpoint | 72.6°F at 08/26/2025 07:00:50 AM |
| Min Dewpoint | -27.3°F at 01/21/2025 01:30:09 PM |
| Max Humidity | 96% at 10/12/2025 09:54:05 AM |
| Min Humidity | 1% at 06/25/2025 02:57:26 PM |
Wind
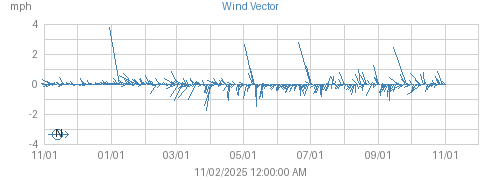
| Average | 1 mph |
| Vector | 0 mph from 157° |
| High | 26 mph from 1° at 08/25/2025 05:12:49 PM |
Precipitation
| Accum | 5.88 in |
| Max Rate | 5.76 in/hr at 10/12/2025 07:41:17 AM |
Temperature
| High | 119.9°F at 06/20/2017 04:30:00 PM |
| Low | 21.4°F at 01/15/2013 08:00:00 AM |
| Max Heat Index | 123.4°F at 07/25/2024 02:36:21 PM |
Conditions
| Max Dewpoint | 77.7°F at 07/16/2021 01:09:04 PM |
| Min Dewpoint | -52.6°F at 06/12/2021 04:30:08 PM |
| Max Humidity | 100% at 04/21/2012 11:15:00 AM |
| Min Humidity | 0% at 06/12/2021 05:36:22 PM |
Wind
| Average | 1 mph |
| Vector | 0 mph from 201° |
| High | 32 mph from 283° at 07/09/2021 10:29:34 PM |
Precipitation
| Accum | 107.41 in |
| Max Rate | 8.47 in/hr at 08/14/2022 05:12:34 PM |
Sun Almanac
| Daylight: | 38850 seconds (-106 seconds) | |
| Twilight: | 06:20:26 AM | |
| Sunrise: | 06:46:41 AM | |
| Transit: | 12:10:37 PM | |
| Sunset: | 05:34:10 PM | |
| Twilight: | 06:00:25 PM |
Moon Almanac
| Phase: | Waxing gibbous (90% full) |
| Rise: | 03:42:58 PM |
| Transit: | 10:03:03 PM |
| Set: | 03:24:35 AM |
| Full Moon: | 11/05/2025 06:19:15 AM |
| New Moon: | 11/19/2025 11:47:13 PM |